
Connected property data
Single Asset View
Structure, compare, link and check information across sources. Bring condition, cost, lifecycle and retrofit data into one Single Asset View for every home.
Request a trialSingle Asset View
95%+
Visibility across your entire stock,
every year.
- Gas checks
- Electrical checks
-
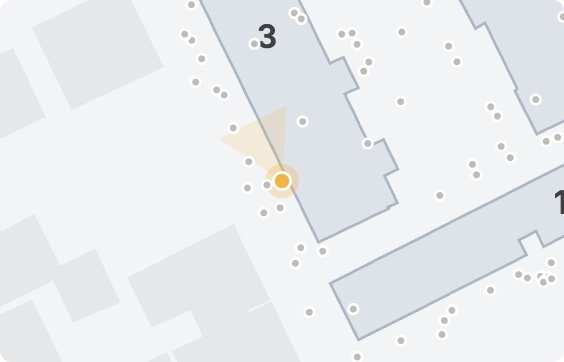
Drone & Google Street View

-
Surveyors
-
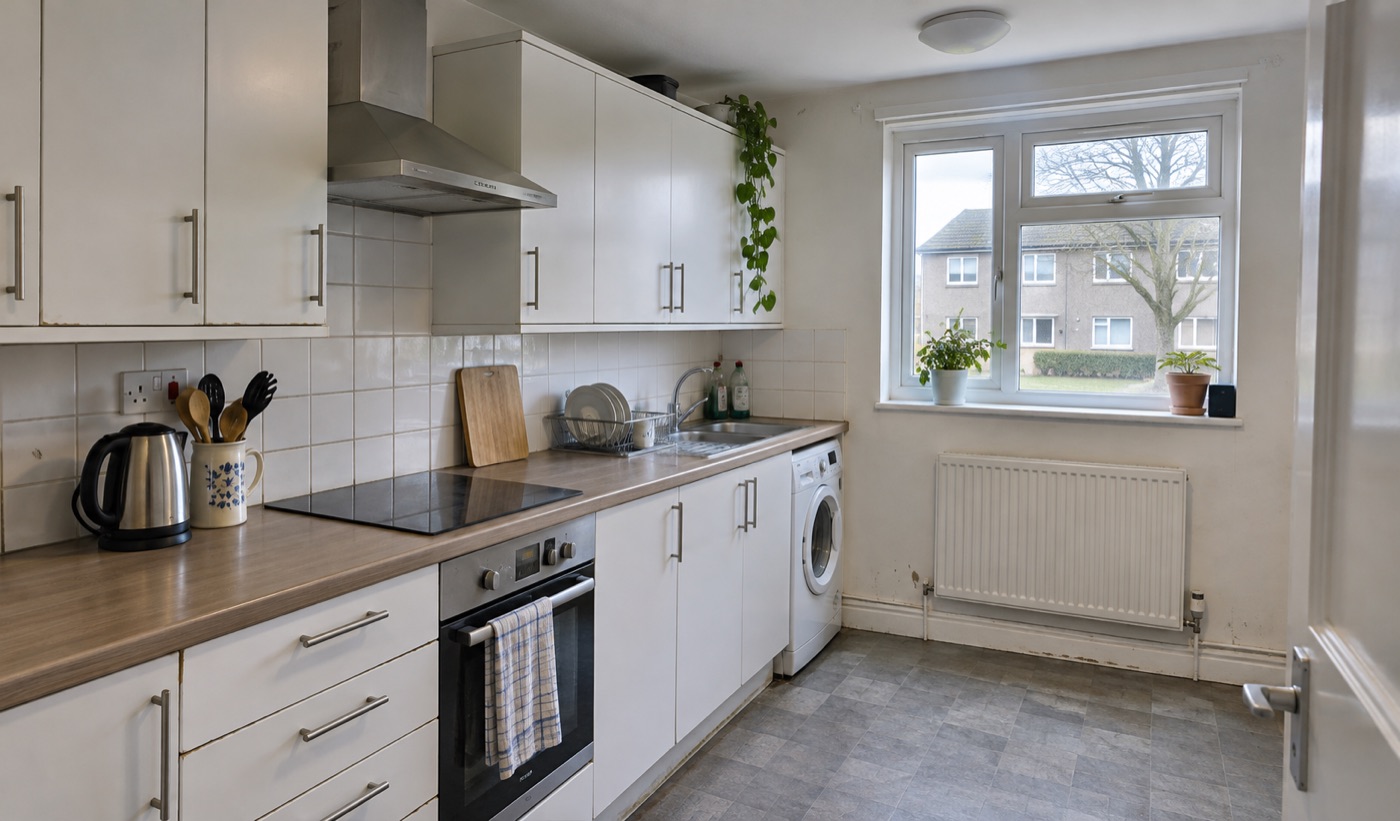
Contractors on site
- Forward maintenance plan
-
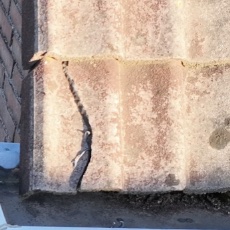
Repairs
- Asset grades
- EPC labels
-
Tenants uploading photos

02 / The challenge
Why today’s tools fall short.
Asset strategy needs a lot of data. Usually, the information is already there. It is just not connected.
Asset registers, surveys, energy labels, repairs, images, financial assumptions and strategic labels each hold part of the answer. But they live in different systems, with different owners and different assumptions.
That works while each team answers its own questions. It breaks when a decision crosses maintenance, retrofit, finance and asset strategy. Should this block be maintained, retrofitted, renewed, sold, redeveloped or inspected further? No single departmental system was built to answer that.
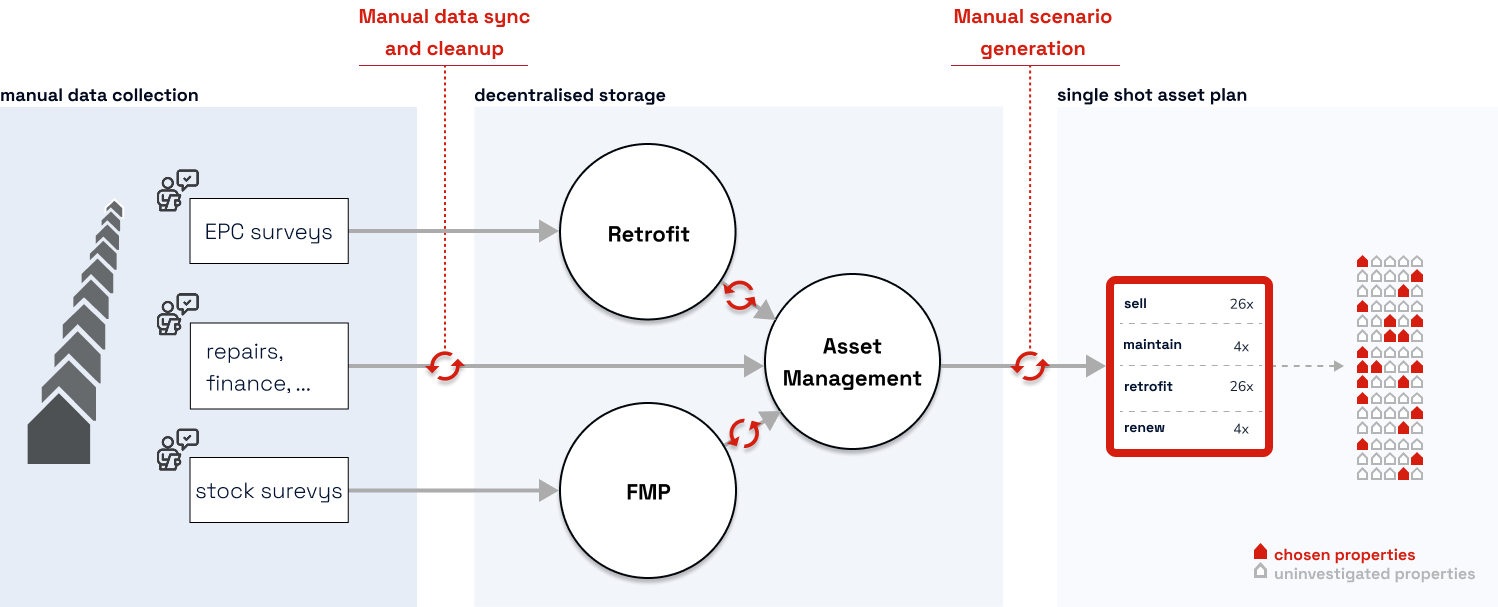
Teams build the missing layer themselves.
They export data, manually clean it, match records and bring it together in Excel or Power BI. Excel becomes the integration layer, Power BI the portfolio view, and the strategic asset plan a carefully assembled snapshot. The workaround is slow, fragile, hard to audit and hard to update.
One plan, because there was no time for more.
When combining information already takes weeks, generating and comparing alternatives becomes expensive. Teams build one plan, maybe two. Often one version becomes the plan simply because it could be assembled in time.
When every scenario starts with weeks of data cleanup, the best option may never make it into the room.

Robert Hicks
Sustainability Specialist · SNG

03 / The operating model
How AI changes asset planning.
AI turns a static planning cycle into a continuously updated workflow. Instead of rebuilding the dataset for every new question, information is collected, cleaned, stored and reused. Surveys, EPCs, repairs, complaints, images, finance data and public sources feed into one portfolio picture that keeps improving over time.
Frequent signals show where work is genuinely needed, where useful life can still be extended, and where larger investments should be timed before standards rise.
Teams move from periodic snapshots and manual scenario building to a workflow where they can compare routes, see trade-offs and defend the choice.
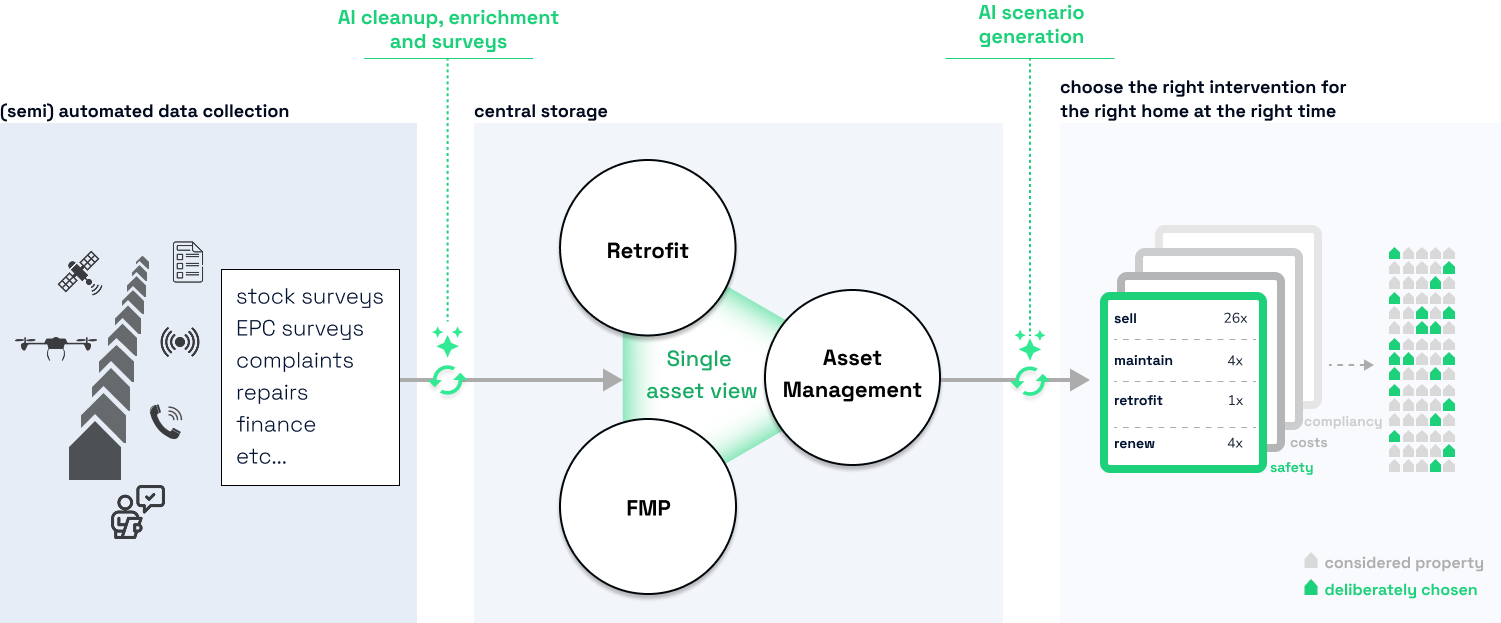
1. The Single Asset View
Surveys, repairs, images, complaints, contractor input and public datasets arrive throughout the year. AI structures, compares, links and checks this messy input to turn it into usable data.
The cleaned information relates condition, energy, repairs, cost, compliance and risk to each home. Every enriched datapoint carries a source, confidence level and review path.
2. AI scenario generation
The shared portfolio picture becomes the foundation for scenarios, interventions and calculations. AI scenario generation turns it into explicit, comparable choices.
Compare different routes, understand the trade-offs and explain why one programme was chosen. The next question starts with the data already connected.
Explore maintenance planningSee it in action.

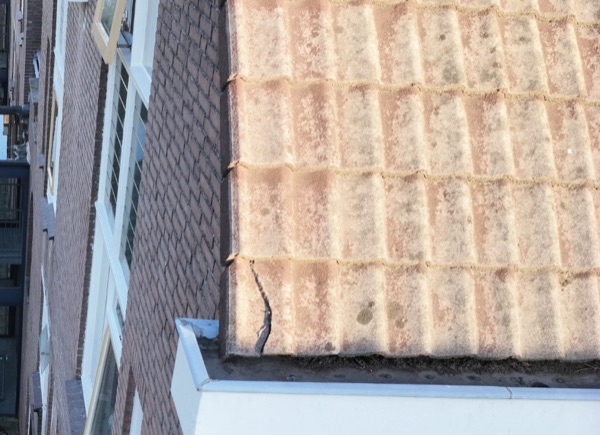
Building imagery & condition
100+ property data fields
Planned works linked to your FMP
Image source · Nov 2026 (example)
Attributes
Available
Property data connected
Plan (FMP)
Partial
Some plan records missing
Element details
Needs review
Check condition and materials
EPC / stock condition export
Property attributes and energy records
Retrofit scenarios · EPC uplift
Forward Maintenance Plan
Existing planned interventions
Baseline scenario
Stock condition survey
Further evidence requested
Condition-led timing